2017 Industry Average Website Conversion Rates
Note: To determine which of these ideas will work for your business, download “The Essentials of Multivariate & AB Testing” by Invesp. Conversion rate information is highly protected on the internet. No one wants to share their website’s accomplishments with competitors. There are few software options to determine website conversion rate.
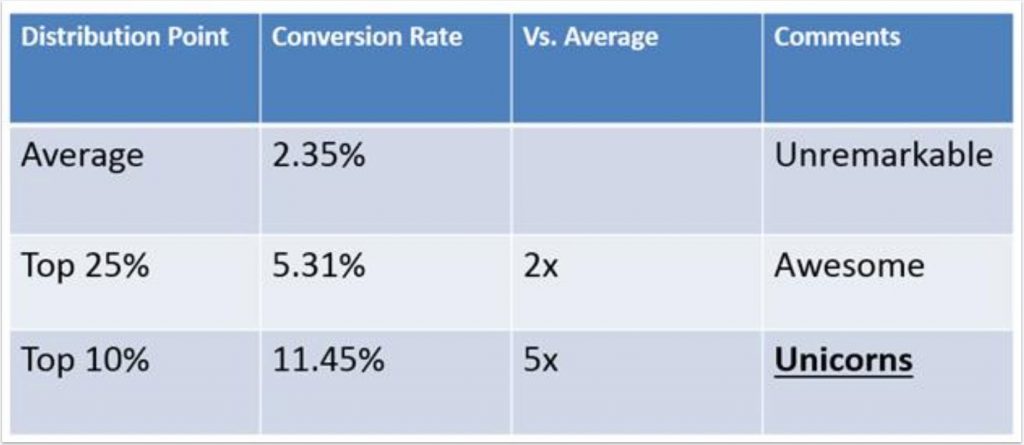
A good conversion rate depends on the industry. If your company meets the average within your industry, you know you must work to improve conversion rates until you are in the top 10%.
Conversion rates are relative. Variables that affect conversions include:
- Type of product
- Traffic source
- Cost of product or average order value
- What device is used
- Location
- Platform (Windows, Mac, etc.)
Rate of conversion typically signifies the percentage of visitors who become customers. You may have different goals. In this report the average conversion rates of standard and top e-commerce sites are based on data from 2014-2016 and separated by industry. Average conversion rates of affiliate, webinar registration, lead generation, platform and device are according to Invesp internal metrics.
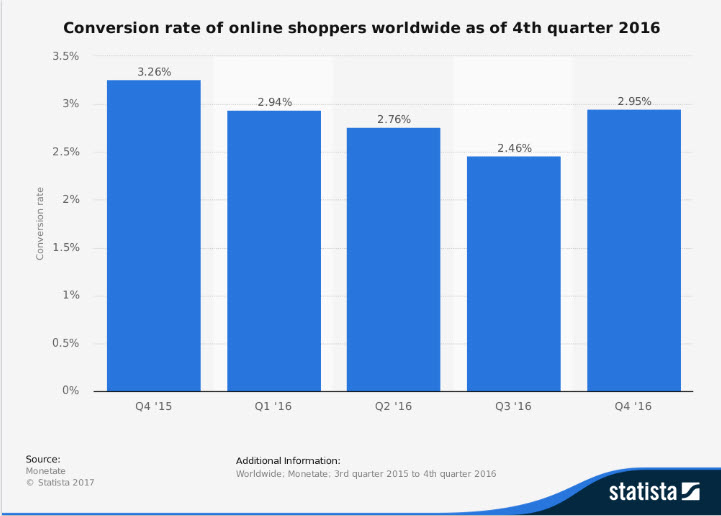
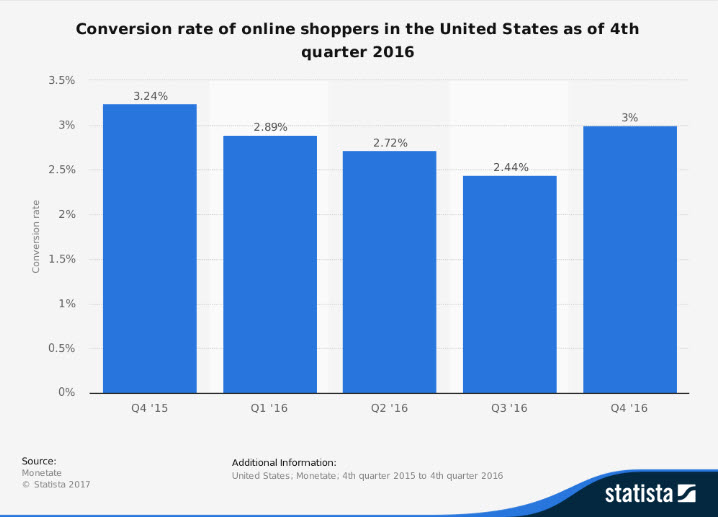
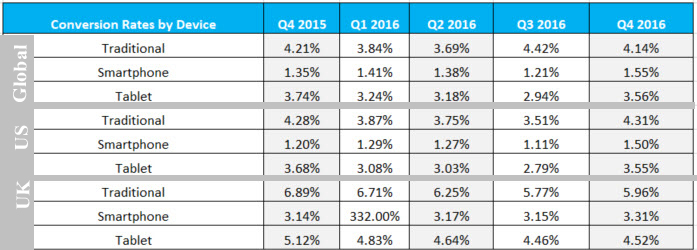
- Online shopper average conversion rates from 4th quarter 2015 to 4th quarter 2016. Presently, the average conversion of shoppers around the world is 2.95%. US online shoppers have a higher average conversion rate at 3%.
Source: Statista
Source: Statista
The average online conversion rate in the UK is pointedly greater than the global average.
Source: Monetate
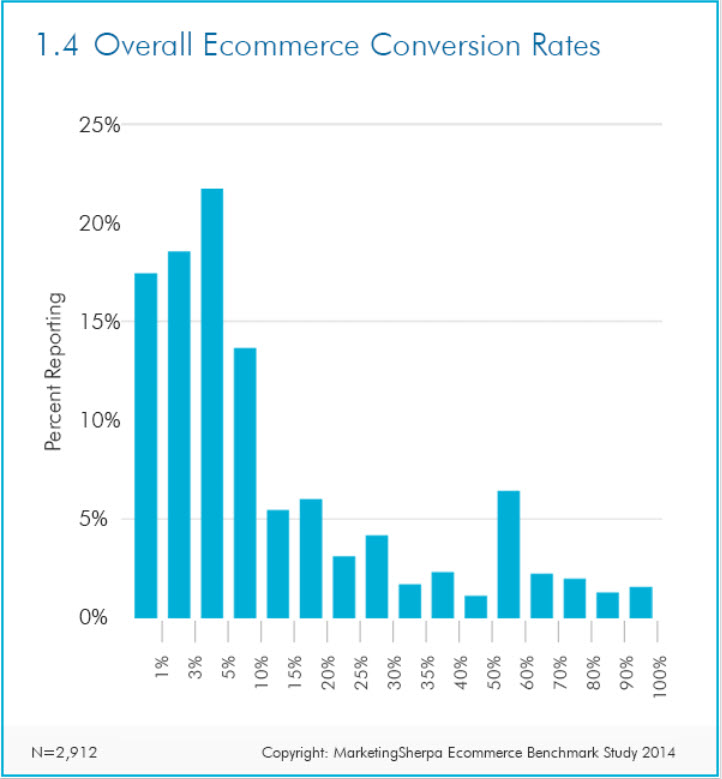
- E-commerce websites average conversion rates showed that 3% of customers were converted in the early 2000s, according to Shop.org. Most stores had conversion rates from less than 1% to 5% in 2014, with several companies reaching greater rates.
2015 FireClick Index data shows an average 7.2% global e-commerce conversion rate.
FireClick index conversion data for apparel and fashion:
Catalog website conversion data from FireClick index:
FireClick index conversion statistics for specialty websites:
Sports and outdoor conversion information from FireClick index:
Software website conversion data from FireClick index:
In 2010, sporting goods and outdoor stores converted less than 1/2 % of their traffic. In 2015, 4.8% of visitors converted into customers in these stores. This is an almost 900% increase in conversion rates.
FireClick index reports that specialty stores convert at the uppermost average rates (7.6%), then catalog websites (6.7%), apparel and fashion (5.9%), sports and outdoors (4.8%) and software (4.1%).
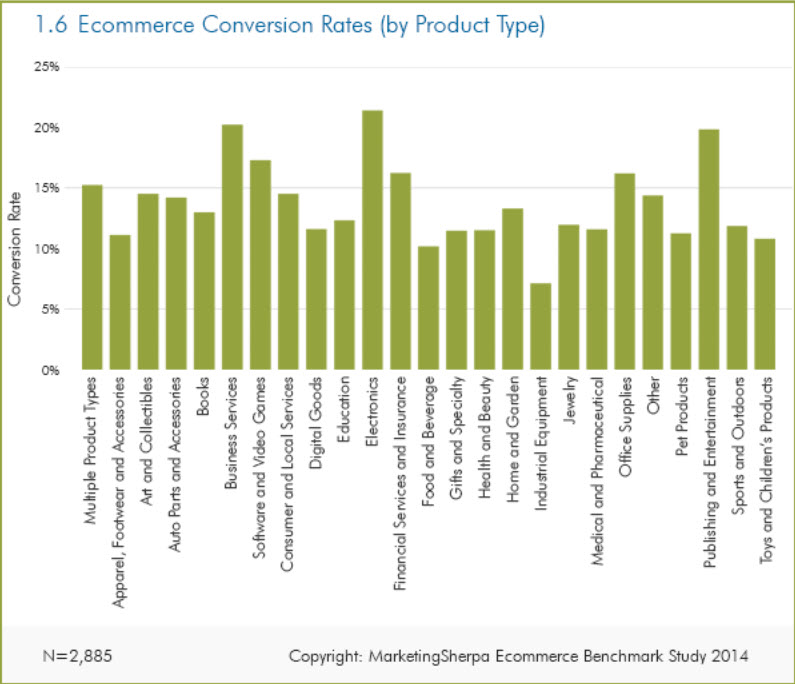
According to a study by MarketingSherpa in 2014, demonstrates that publishing, entertainment, video games, software, business services and electronics products convert better than other products.
A benchmark study from MarketingSherpa, from 2014, on the other hand, shows that business services, electronics, software and video games, and publishing and entertainment related products convert considerably better than other product categories.
The study also noted that catalog stores have a 6.7% conversion rate and specialty stores have a 7.6% conversion rate, while niche stores have more success than general stores.
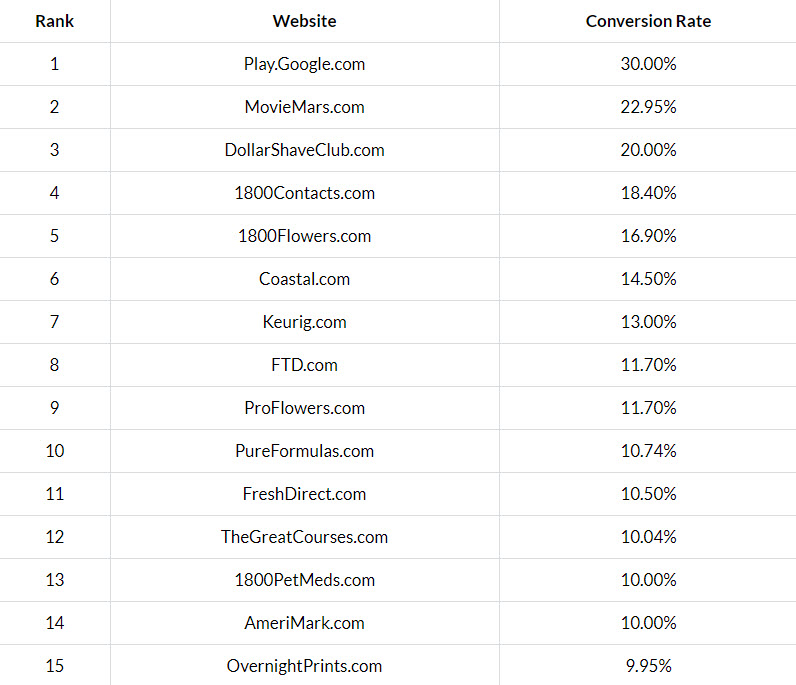
- Top e-commerce website average conversion rates
2014 data demonstrating the top 15 online retailers’ conversions.
- Lead generation average conversion rates are not published. After evaluating apx. 35 lead generation websites, Invesp internal metrics indicated an average of 13% of visitors converted into customers. The top converting site sustained a rate of 28%.
- Affiliate websites average conversion rates are also not published. Based on about 17 affiliate websites, Invesp internal metrics notes that 26% of their visitors converted to customers.
- Freemium average conversion rates are high. Here are some conversion rates of freemium providers, according to Business 2 Community:
- Webinar registration pages average conversion rates are difficult to evaluate. There is more interest in using webinars to generate leads, but few blog posts and articles have addressed the issue.
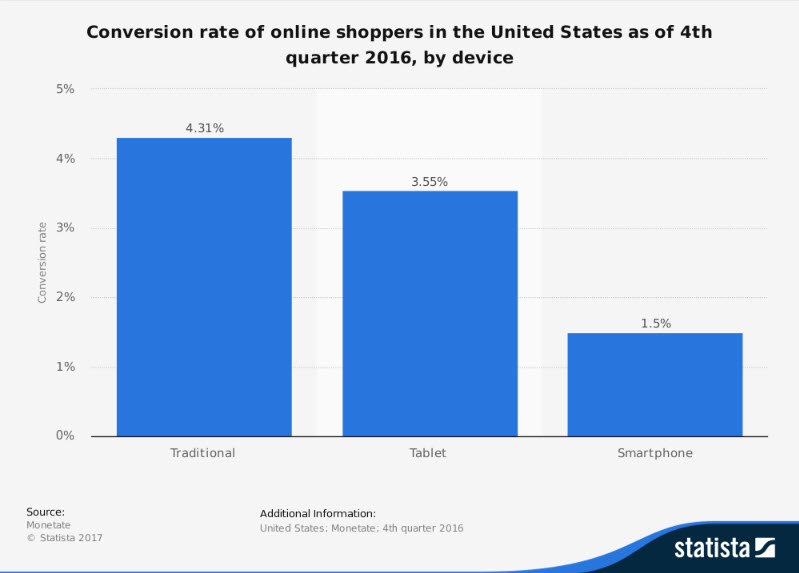
- Typical conversion rates by device show that, at the close of 2016 in the US, laptops and desktops convert at a much higher rate than mobile devices. Conversions on tablets more than double those on smartphones.
Source: Statista
Consumers prefer to utilize more conventional devices for shopping purposes, while smartphones are used for browsing. Traditional devices also beat mobile in both the UK and global average conversion rates.
Source: Monetate
- Platform average conversion rates show that in the last quarter of 2016, Mac users purchased more than Windows users, who bought a lot more than Linux users. Conversion rates remained the same for Windows and Mac users in the 2nd quarter of 2016. iOS performed better than Android in mobile platforms.
Source: Monetate
- Highly driven visitors have higher conversions.
- To understand your website visitors, you must know the difference between converting and browsing, as this has a direct effect on your conversion rates. Are they conducting research or planning to buy online? There are 3 types of visitor intent:
- Surf online and buy online: books, toys, clothes, event tickets, making reservations
- Greater browse online and reduced buy online: computers, electronics, sporting goods
- Less browsing online and higher buying online: airline tickets
This information can be quite helpful when considering the type of visitors you have to your website.
- How to improve an average conversion rate
WordStream notes that the top 10% of stores demonstrate almost an 11.5% conversion rate
Instead of focusing on obtaining an average conversion rate, note what the top 10% are doing and use this information to improve your own conversion rates by:
- Concentrate on the top converting traffic channels by utilizing your analytics report to determine where most of your traffic originates.
- Make it a priority to promote products and categories that convert the most.
- Use the information in you’re A/B tests to make changes beyond cosmetic fixes.
- Try different offers like having a sale.
- Revamp page designs.
- Alternate traffic sources. Take advantage of remarketing to push conversion rates higher.
- Diminish the rate of cart abandonment by optimizing the check-out experience. According to Monetate, the global rate of visitors who add an item to their cart is 9.58%.
This same study shows that the average conversion rate is only 2.95%. Too many people ditch their cart.
- Utilize a mobile shopping app.
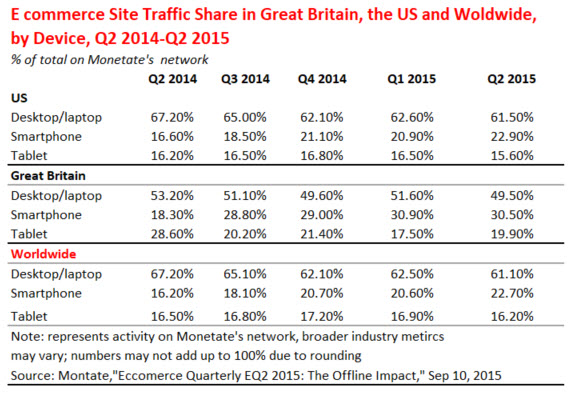
E-commerce site smartphone traffic has grown from 16.6% in the 2nd quarter of 2014 to 22.9% of traffic in the 2nd quarter of 2015. However, smartphone traffic conversion rates are much lower than tablets and desktops. An improved mobile shopping experience can significantly increase your conversion rates.
A mobile app can:
- Offer a personalized shopping experience with tracking and location data.
- Notify customers about deals and sales.
- Provide a more creative shopping experience and perform more effectively than larger devices.
If you opt to not purchase a mobile app, ensure that your website is optimized for mobile devices. Mobile-optimized sites convert more than 100% over non-optimized ones, according to Criteo.
Connect with Top Marketing Agency at (888) 843-9840 for more information on conversion rates.



















My business has worked with Top Marketing Agency for the past few years and they have been amazing. Their agency is like an extension of our company, they know what we need and they are driven to help us succeed!